Source: S&P Global Platts RADAR, March 7, 2019
Bob Williams, S&P Global Platts
In an article by Andrew Cooper of S&P Global Platt’s Analytics last month, we introduced a new methodology for estimating weekly the count of drilled but uncompleted (DUC) wells.
Andrew parsed the distinctions of DUCs as to their vintage. This is a critical piece of information for several reasons: 1) to gauge future potential oil and gas supply and how that will affect commodity prices, 2) future completion rates and whether there will be sufficient service and supply capacity, and 3) whether there will be enough drilling rigs (or too many) if this pace of drilling the DUCs keeps up.
It is this last item that is the focus here this week.
DUCs have become a significant factor in drilling, completion, and production only fairly recently with the rise of unconventional resource drilling. The proliferation of pad drilling and walking systems, combined with batch drilling of wells, has been a game-changer in the speed and efficiency of drilling. In a sense, operators have kept one step ahead with drilling results by always keeping a running inventory of potential wells at the ready.
The DUCs could be “banked” for future completions as needed to maintain a reliable production stream; or to hold in abeyance pending an improvement in commodity prices. It is the long-touted “factory” business model come to fruition that, theoretically, can enable industry to calibrate production supply as needed and maybe pave the way to smoothing out the endless cycles of boom and bust.
FREE TRIAL OFFER Receive a free one month trial of Platts Rigs and Drilling Analytical Report (RADAR). Each week you'll receive the latest analysis of unconventional activities and trends in the upstream market. Operators are categorized by major shale plays and unconventional formations. Plus, you'll have analysis of the drilling contractors involved by play with details on utilization, footage and market share. Available in both pdf and Excel format.
Call 800-371-0083 or email CustomerService.RigData@spglobal.com.
Mention code 7HHONRPT
Well, that’s the idea, anyway. Every state has its own rules on conservation, every operator has its own priorities, and drilling contractors and other vendors have their own problems with capacity. Still, it’s instructive to compare the DUC counts and rig tallies and assess their relationship to ferret out patterns and see if it’s relevant.
DUCs-Rigs Patterns
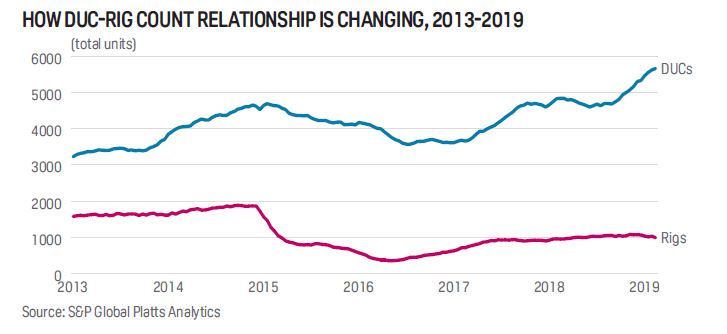
When the business cycle was good in 2013-2014, the rig count averaged 1,600–1,800 pad drilling was beginning to take off; drillers could barely keep up with making the model of rig that everybody wanted to expedite batch drilling. DUCs were almost at 2:1 ratio with the rig count.
Then came the bust, with its historically low rig count in 2016, and the rig count fell to 20% and then 12% of the DUC count. In October 2014, the rig count began a long plunge from 1,881 to a record low of 352—an 81% fall. The DUC count from peak to bottom came a few months later in both instances but only amounted to a drop of about 25%. But the DUC count started to rise again when the rig count was still below 500.
In 2017, DUCs topped 4,000 and have been there ever since while the rig count averaged about 20% of the DUC count.
This year, the rig count slipped to 18% of DUCs. But that is due largely to the infrastructure hurdles in the Permian.
It seems the best ratio for DUCs to rigs is about 5:1. Those were the years in which there is no boom and no bust.
Operators has pledged (to Wall Street, anyway) that they will hew to wells with the best return. And that would seem to serve the 5:1 ratio. Maybe end the cycles once and for all.
But then again, Wall Street has called into question the reliability of operators’ estimates of viable future locations, suggesting that some leading companies’ growth is overstated.
Maybe once the Permian logjam is cleared up, we’ll have a better idea. And maybe the industry won’t be a victim of its own success again.
This is article is from S&P Global Platts RADAR, March 7, 2019 issue.
Call 800-371-0083 to request a sample copy.
Upstream Activity Data for North America
For more information on North American upstream activity including permitting, drilling activity, production and completion data please contact S&P Global Platts via email CustomerService.RigData@spglobal.com or call 800-371-0083.
FREE TRIAL OFFER
Receive a free one month trial of Platts Land Rig Newsletter (4 issues). Each week you'll receive the latest analysis of unconventional activities and general trends in the upstream market. Operators are categorized by the major shale plays and unconventional formations where activity is occurring. Plus, you'll see the drilling contractors involved by play with details on utilization, footage and market share. (Available in pdf and Excel format.)
Call 800-371-0083 or email CustomerService.RigData@spglobal.com.
Mention code 7HHONRPT
