From RigData’s RADAR Report, February 11, 2016

The impact from steep well decline curves (associated with horizontal drilling into tight oil formations) is starting to influence average well production metrics across the two largest oil producing states, Texas and North Dakota.
Whether comparing over time the incremental change in well production (i.e., the change in daily production divided by the change in well count over the same period) or the average daily well production, both convey the message that the massive reductions in activity stemming from capex cuts are causing production to wane.
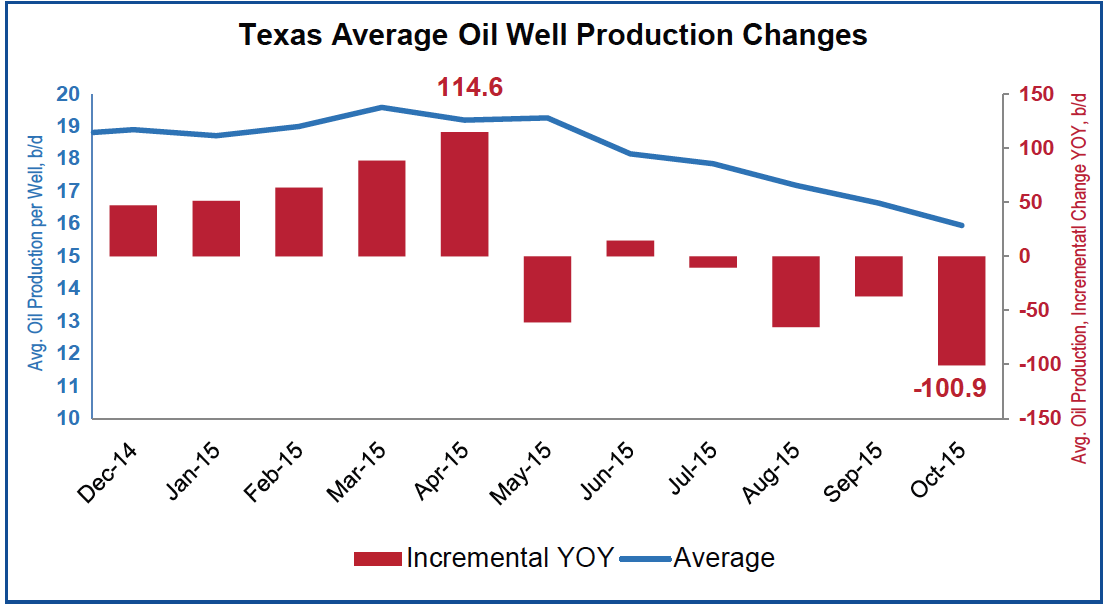
A year ago, daily Texas production, divided by its number of producing wells, grew at a pace of 10.7% per annum. Then (January 2015), an average Texas oil well produced 18.7 b/d, or 1.8 b/d more than the average a year prior. The recent peak for average well production occurred in March 2015 at 19.6 b/d. But since that point, the slope of daily Texas oil production per well has declined to where the average (16 b/d) is at its lowest level over the past 2 years. Furthermore, the drop in average production by -2.2 b/d/well from October 2014 to October 2015 translates into a reduction of -343,000 b/d over the past 12 months (from 3.3 million b/d to 2.9 million b/d).
Incremental daily production figures per Texas well really hammer the point home. The incremental production calculation now yields negative barrels, which is impossible in a literal sense unless the industry has started to use newly drilled wells for storage purposes. So the existence of negative incremental barrels implies that the decline in legacy well production is greater than the gains made from the drilling of new wells. Simply put, the industry is no longer drilling enough oil wells in the US to hold production flat.
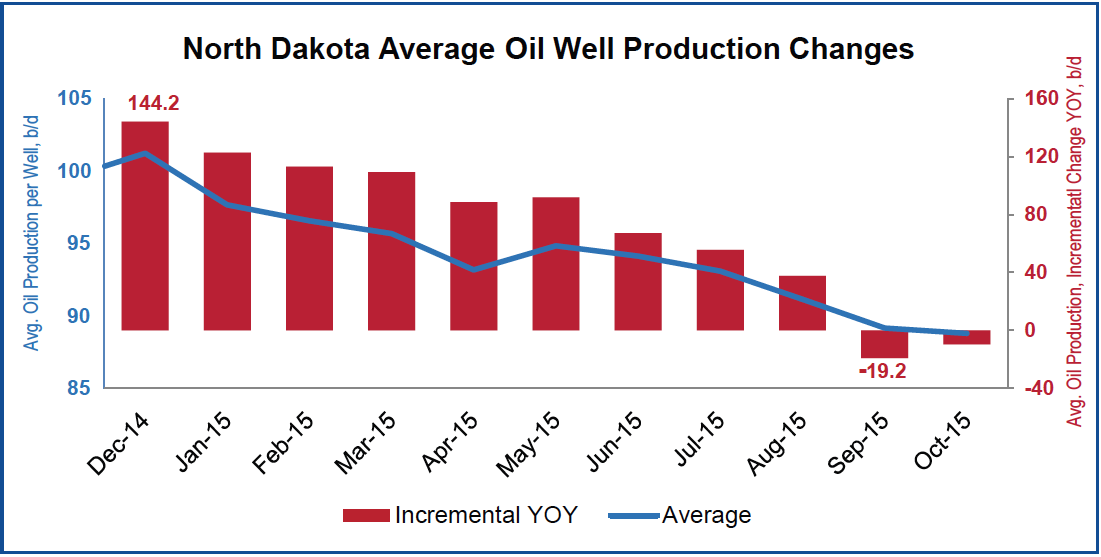
Texas recorded negative incremental production ahead of the second-largest onshore US oil producer, North Dakota. Still, North Dakota has also begun to feel the impact of declining daily production, as its number of new wells drilled each month is no longer sufficient to absorb the decline curves there. Specifically, North Dakota has experienced greater declines in terms of absolute barrels per well lost than Texas experienced. However, the results here are influenced by Bakken wells generally producing 9x greater volumes than the average Texas well and by the significantly smaller pool of producing wells that exist in North Dakota.

At the beginning of last year, North Dakota’s oil well volumes averaged 97.7 b/d, 5.1 b/d more than in January 2014. Jump ahead to October 2015, and North Dakota’s average crude production per well fell by -10.6 b/d (88.8 b/d vs. 99.4 b/d the prior year), amounting to about 12,500 b/d of lost production statewide since October 2014. Total production registered about 1.2 million b/d in the state during October 2015.
Texas and North Dakota contribute about half of all US crude and condensate production on a daily basis. This fact leads us to our next point that just a few states are responsible for a majority of US crude production. So it is possible to get a sense of how the crude supply in the US is developing without compiling observations from every state.
Six top Lower 48 producing states
Six states within the Lower 48 accounted for 6.27 million b/d of crude and condensate production, or 67% of total daily US production during November 2015. Listed in order of volume from largest to smallest, those six states are Texas (3.4 million b/d), North Dakota (1.17 million b/d), California (548,000 b/d), New Mexico (413,000 b/d), Oklahoma (403,000 b/d), and Colorado (335,000 b/d). Considering that November production figures are according to the EIA—whose methodology, we recently wrote, has some question marks that need explanation in Texas—we recommend against getting too wedded to these figures in absolute terms but do suggest understanding the developing trends.
The combined crude and condensate peak production for these six states occurred in March 2015 at 6.6 million b/d. Compared to the EIA’s November results, production from Texas, North Dakota, California, New Mexico, Oklahoma, and Colorado has been curtailed by -338,000 b/d since the March peak. This implies that, on average, these six states collectively are removing about 42,000 b/d from production with each consecutive month that transpires.
The remaining onshore producing states have cut production by -102,000 b/d since last March. Dividing again by the subsequent 8 months of production data supplied, we get an average month-to-month (MTM) reduction trend of about -13,000 b/d less.
Interestingly, US offshore production has improved by 108,000 b/d over the past 8 months ended in November. So daily offshore production trends and collective US land production trends (outside of the aforementioned six biggest producing states) essentially cancel out one another, leaving just these remaining six largest producing Lower 48 states to dictate both the direction and the pitch of the US production curve going forward.
Focusing on these six states’ data—as collected by their state agencies (while using the EIA’s monthly estimates for remaining US onshore and offshore production)—points to even greater average daily production curtailment through November 2015. These state agencies’ monthly production figures for 2Q15 show a combined MTM sequential reduction of -71,000 b/d. Backing out an additional 29,000 b/d each month since March 2015 from EIA estimates (71,000 b/d - 42,000 b/d = 29,000 b/d) would then imply that overall daily production was about -232,000 b/d less than the 9.3 million b/d that the EIA reported for November 2015.
Implications for future rig counts
Unfortunately, there is still more to consider. The difference between what these 6 states reported as daily production vs. the EIA’s production figures widened from an insignificant 14,000 b/d during July 2014 to a material 469,000 b/d in March 2015. Recall that March was the month we used as the base month for extrapolating what US production would resemble in November 2015 if the curtailment pace was -71,000 b/d, similar to these 6 states’ aggregated indication. Removing this starting base discrepancy would then imply that US crude and condensate production has actually been below 9 million b/d since May 2015.
The key word in commentary so far is “imply.” We would not recommend relying on monthly production figures from either the EIA or a state agency as gospel. Collection and timing issues tend to create reporting inconsistencies in the most recently reported results that then lead to revisions down the road. In the end we are stuck with estimates that may or may not jibe with the perceived reality of the moment.
Still, the key takeaway message for us is that—regardless of which reporting bodies’ data are used—not only is production declining from the reduction of existing drilling projects, the march down the industry’s decline curve now militates against and even more in some cases obscures efficiency gains captured over the past 2 years. Taking this idea to its logical conclusion would yield an understanding that the rig count’s importance as a gauge of the industry’s health will only strengthen from this point forward.
