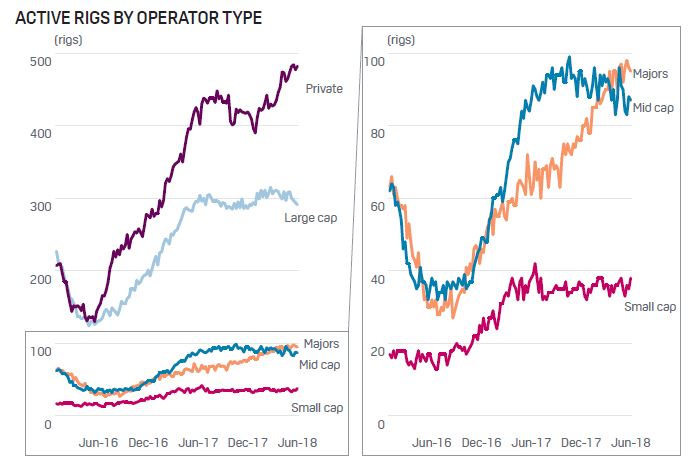
 Source: S&P Global Platts Analytics
Rig Count Growth Following Barbell Pattern
Trey Cowan, Senior Industry Analyst, S&P Global Platts
Privately held companies are responsible
for most of the growth in the US rig count during 2018.
Represented by the purple line in
the left-hand graph (which segments
the US land rig count by operator type);
270 private companies are using nearly 500 rigs to drill their wells. Relative to
activity levels at the end of 2017, the
privately held group’s rig count is up 91 rigs and accounts for 82% of the year-to-date
growth in the overall rig count.
The rig counts of publicly traded
producers (segmented by size) have
experienced a flatter trajectory year-to-date, with one exception. Represented by the red
line in the graphs, the Majors (integrated
oil companies whose membership includes
Chevron, ExxonMobil, ConocoPhillips,
Royal Dutch Shell, and BP) have increased
their rig activity by 22% since the
beginning of the year.
ExxonMobil an outlier
But digging in a little further we
see that just one company (among the
Majors), ExxonMobil, was responsible
for all of the segment’s growth year-todate.
In fact, ExxonMobil has nearly
doubled its rig activity from the beginning
of the year until now—and with this rig
growth has catapulted itself back into the
top spot in the rankings, having the most
land rigs actively deployed in the US with
a fleet of 43 rigs.
The Permian, SCOOP/STACK, and
Haynesville were all hosts to additional
rig activity where Exxon Mobil’s drilling
fleet grew this year.
So the rig growth that we have seen
thus far this year has followed a barbell
pattern in that the largest company drilling
in the US and the typically small private
companies are leading the charge.
Output grows even with steady rig count
Meanwhile, the rank-and-file
operators in the middle have shown little willingness to increase their drilling activity levels.
FREE TRIAL OFFER
Receive a free one month trial of RADAR (4 issues). Each week you'll receive the latest analysis of unconventional activities and general trends in the upstream market. Operators are categorized by the major shale plays and unconventional formations where activity is occurring. Plus, you'll see the drilling contractors involved by play with details on utilization, footage and market share. (Available in pdf and Excel format.)
Call 800-371-0083 or email CustomerService.RigData@spglobal.com.
Mention code 7HHONRPT
However, the lack of upward
change to rig counts by most publicly
traded operators this year is not an
indictment on production growth. The
ever increasing well intensity shown
by operators in the wells they have
drilled of late continues to add more incremental units once these wells are completed relative to their predecessors. Thus, all else being equal, production is expected to rise even if drilling holds in
a steady state here in the US.
The take-away for the back half of
2018 is that we would expect stability (in
terms of drilling patterns) from much of
the publicly traded operators at today’s
prices or even a slight pullback in oil and
natural gas futures.
But private operators have tended to
exhibit more price sensitivity. Thus, a
slight slump in commodity prices could
adversely impact this group’s plans (that currently directs about half the rig count activity) over the remainder of the year.
Upstream Activity Data for North America
For more information on North American upstream activity including permitting, drilling activity, production and completion data please contact S&P Global Platts via email CustomerService.RigData@spglobal.com or call 800-371-0083.
