Source: Drillinginfo RigData RADAR, August 21, 2019
Trey Cowan, Senior Analyst, Drillinginfo
“It’s different this time!” is probably one of the most overused phrases relating to commentary on the oil and gas markets. Its use is especially common at times when prognosticators and pundits want to go against the grain of years of historical cyclical trends and predict an opposite outcome to what current data and patterns prescribe. However, if enough time elapses, then some of these against the grain predictions are ultimately validated by the results.
Which brings us to our second industry euphemism. “Even a broken clock is right twice a day.” Here an unreliable prediction calls a future event correctly, not because the projection when made was prescient, but because the cycle eventually changed over time. An example would be pundit declaring that oil prices were headed higher when all the data indicated weakness was on the horizon. But by waiting long enough the weakness passes and then a recovery ensues and prices once again head higher.
FREE TRIAL OFFER
Receive a free one month trial of RigData Rigs and Drilling Analytical Report (RADAR). Each week you'll receive the latest analysis of unconventional activities and trends in the upstream market. Operators are categorized by major shale plays and unconventional formations. Plus, you'll have analysis of the drilling contractors involved by play with details on utilization, footage and market share. Available in both pdf and Excel format.
Call 800-371-0083 or email CustomerService@RigData.com
Mention code 7HHONRPT
REE TRIAL OFFER
Receive a free one month trial of Platts Land Rig Newsletter (4 issues). Each week you'll receive the latest analysis of unconventional activities and general trends in the upstream market. Operators are categorized by the major shale plays and unconventional formations where activity is occurring. Plus, you'll see the drilling contractors involved by play with details on utilization, footage and market share. (Available in pdf and Excel format.)
Call 800-371-0083 or email CustomerService.RigData@spglobal.com.
Mention code 7HHONRPT
FREE TRIAL OFFER
Receive a free one month trial of Platts Land Rig Newsletter (4 issues). Each week you'll receive the latest analysis of unconventional activities and general trends in the upstream market. Operators are categorized by the major shale plays and unconventional formations where activity is occurring. Plus, you'll see the drilling contractors involved by play with details on utilization, footage and market share. (Available in pdf and Excel format.)
Call 800-371-0083 or email CustomerService.RigData@spglobal.com.
Mention code 7HHONRPT
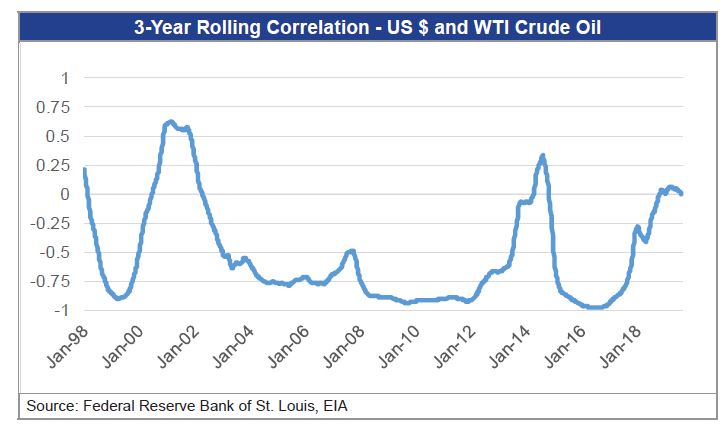
There is one historical pattern in the energy markets that vacillates over time (displayed in the opening graphic). This is the correlative relationship between oil prices and the strength or weakness of the US dollar relative to foreign currencies. At some points in the cycle the three year correlation between oil prices and the dollar is directly linked but at most other times an inverse relationship exists. Looking at an extended period of 20 years we note that the dominant phase is inverse correlation. Specifically, we observed that over the past two decades only 15% of the time was marked by periods of positive correlation.
However, at the moment we appear to be at an inflection point for the relationship between oil prices and the US dollar’s strength where positive correlation exists but is also fading. Previous inflection points occurred in 2001, 2008, and 2014; when correlation flip flopped from trending directly to trending inversely. To illustrate the inflection more clearly we overlaid WTI crude prices with the correlation of it versus the US dollar. The red dashed circles highlight these inflection points. Each time that correlation reversed course to trend towards its normal state was marked by a decline in oil prices.
For things to be “different this time” the oil markets would need to rise over the next few months. We have previously noted that IMO 2020 (i.e. the reduced Sulphur mandate for shipping fuel that kicks in at the beginning of the year) has been a rally cry for higher oil prices. Another has been the shifting position the Fed has taken over the past year moving from a hawkish to dovish leaning. In this case, the suppression of interest rates infers a weaker dollar which tends to relate to oil prices moving higher.
Besides the cyclical correlative patterns that we have outlined favoring a declining oil price environment in the months ahead, global fundamentals support a bearish outlook. Most recently, the Organization of the Petroleum Exporting Countries (OPEC) in its Monthly Oil Market Report forecasted incremental year-over-year global oil demand growth of 1.14 million barrels per day during 2020, less than one half its incremental non-OPEC supply estimate of 2.39 million barrels per day for next year. In our opinion, a global surplus expectation, such as OPEC’s for the coming year, make’s a strong case for why things most likely will not be different this time.
